Are you looking for Excel tips for students?
If Yes, keep reading this article till the end. In this article, we’re going to break down 7 Tips for using Excel that will really help you to get ahead in class.
Despite the rise of newer technology, Microsoft Excel continues to be a valuable tool for various businesses. Its versatility and accessibility make it highly useful as an analytics tool, particularly regarding reporting.
But Excel is not only valuable to businesses; students can also benefit from learning how to use it.
Excel can make students’ lives easier by simplifying tedious tasks and helping to organize and process data. Skills like formulas, pivot tables, and formatting can come in handy when studying for exams and researching papers.
Unless you’re new to Excel, you already know what it is, and the basic features it has, so I won’t cover these topics. Instead, this article discusses how you can use Excel as a student to improve your study habits, organize your information, and research more efficiently, that further will help you to become successful in college.
However, if you want to learn the basics of Excel for free, I have two courses for you: “Introduction to Microsoft Excel” on Coursera and “Useful Excel for Beginners” on Udemy. (Feel free to thank me in the comment 🙂
Excel Tips for Students:
Now let’s dive straight into the tips that I’ve brought for you…for using Excel and getting ahead in class.
1. Automate Tasks
One of the ways MS Excel can help students is to help them automate several monotonous tasks like applying style and formatting, communicating with data sources, or creating new documents.
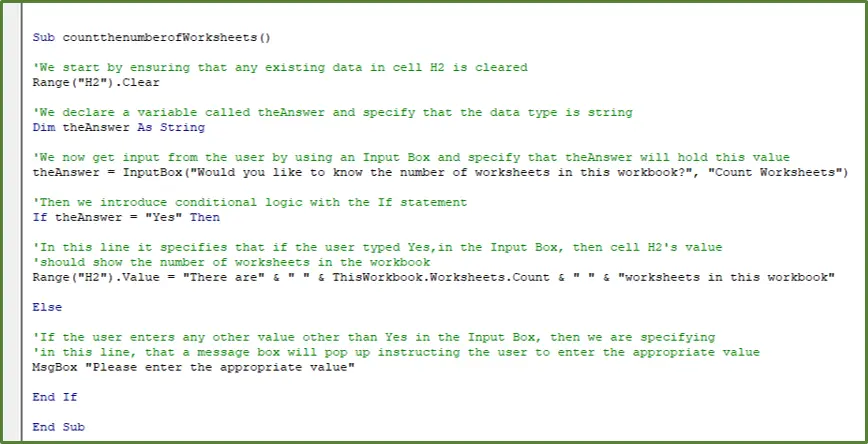
Macros can be used to automate the creation of periodic tables or data lists, saving you from having to assemble them manually each time you start a new assignment.
To create Macros, you must first turn on the pivot that’ll have a view that lets you add a Macro. To do this take the below steps:
- Navigate to the bottom of the file menu and select options.
- A pop-up menu comes up. On the left sidebar of the pop-up menu, click on “Customize ribbons.”
- Next, check the developer box, and a new pivot called “developer” is created.
- Click the other “developer” option, and a new window will open titled Developer Ribbon.
- Select the new option called “macros.” If Excel is already open, you should save it as a macro-enabled file.
- Next, select the file you want to edit, and in the formula bar, select “record macro.”
The code will now show the actions Macro will execute. Type the code you want Macro to complete, and then press “replay” to get Macro to run the code for you.
The benefits of macros are not only limited to repetitive tasks. Excel can also help you communicate with external sources like databases or websites. In these situations, you can create specific codes that automate the process and automatically send the results via a spreadsheet link.
You can increase productivity and improve time management by automating Excel’s tasks, knowing the more time you spend on these activities means fewer opportunities to work on other activities that can help improve your grades.
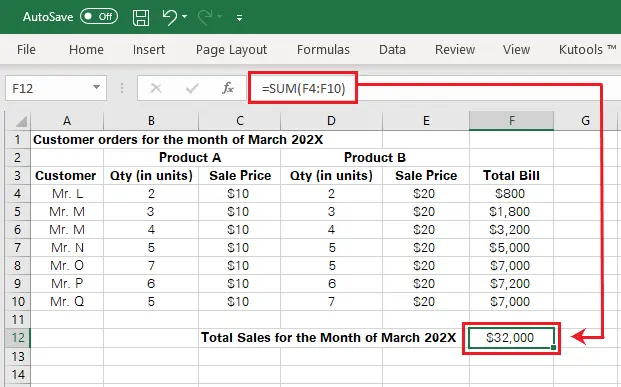
2. Organize and Interpret Data
While studying in school, you may need to organize and combine information from multiple sources into large tables or visualizations.
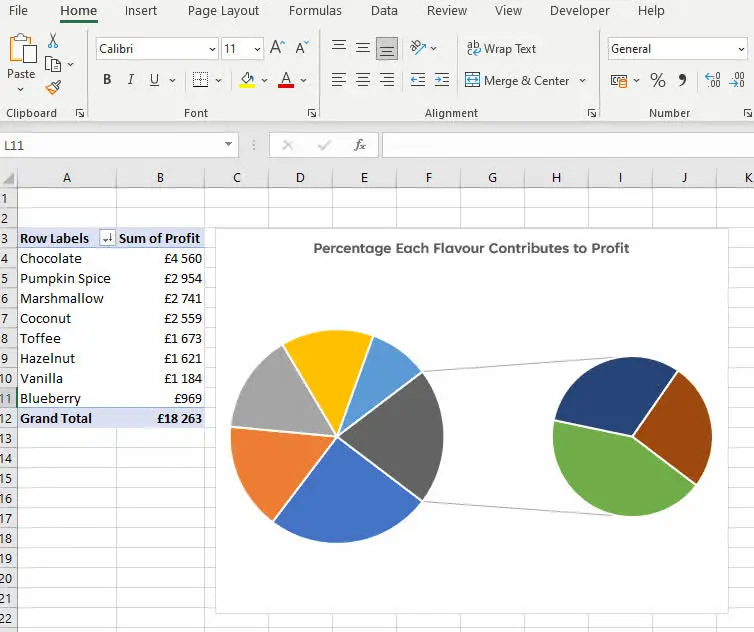
Excel can help by providing various tools to help you organize data from multiple sources, such as combining and sorting lists, identifying trends using charts, or building PivotTables to compare data.
For example, if you are studying for a term on government, you can use Excel to see which countries have the highest debt or unemployment rates. Excel can also help you interpret data and visualize it, such as showing you the population distribution in a country or predicting the probability that you’ll get an A on your last exam.
Excel’s formatting tools and charts will help you analyze your data and give you new insights that you can incorporate into your assignments.
You can also utilize a function like VLOOKUP when you need to find information in a large spreadsheet. This function allows you to choose data from specific columns based on a specified value in another column.
A significant advantage of using Excel to interpret data is the amount of flexibility it gives you when analyzing and processing information.
With more advanced Excel courses, you can customize your data analysis with more advanced functions and techniques that will give you an edge over your classmates.
3. Eliminate Errors
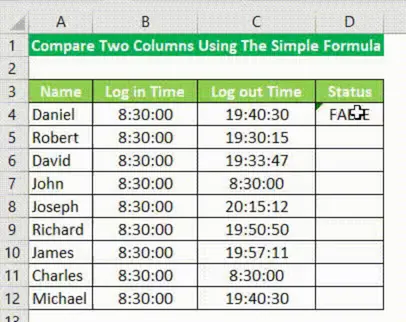
Even if your data is clean and organized in Excel, errors can still happen.
For example, the formula you use for calculating the confidence interval on your gut check data could be wrong, throwing off your result instead of giving you accurate data.
Excel’s built-in error-checking tools allow you to find mistakes when inputting data from multiple sheets or highlight potential errors in your formulas.
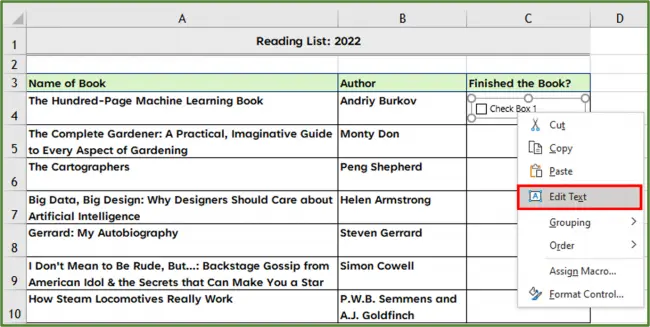
4. Presentations
You have a presentation to make to the class or class assignments, but you know you’re covering the basics. Let me tell you something interesting…
You can use MS Excel as a visual aid to make your presentation/task more exciting and easy to understand. You can design slides that present ideas and research and then show them using charts that display your data visually.
With Excel, you can take something as simple as writing down a few key points and add visual elements to make a more engaging presentation. A few examples you can use are:
- Creating interactive charts that go beyond boring bar charts.
- Presenting data in a more straightforward and concise way.
- Building a game where you input a score and a graph updates synchronously.
- Interacting with the presentation on screen.
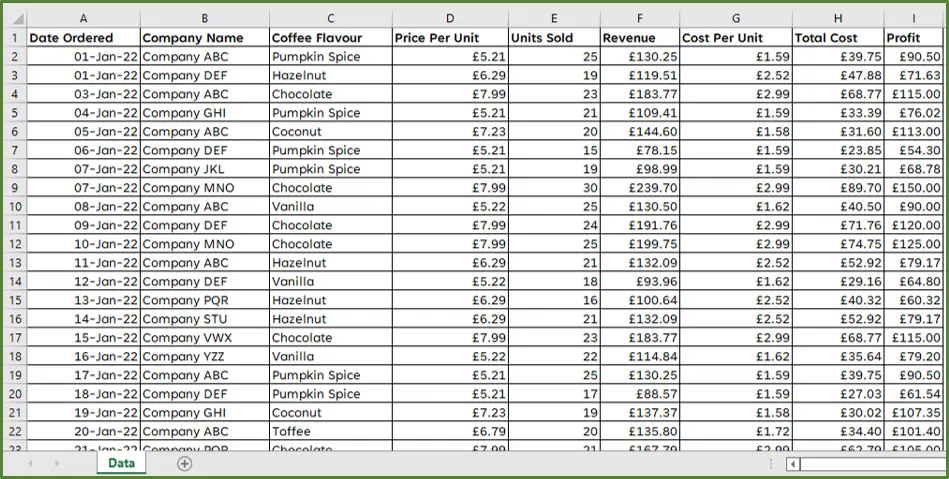
5. Help in Research
Excel is not just useful for creating reports and presentations; it can also be helpful when conducting research. Excel’s charting tools can help you visualize results in real-time more conveniently and concisely.
For example, suppose a researcher is studying the impact of a marketing campaign on sales with a control group. In that case, the researcher can use MS Excel’s PivotTable tool to compare data between the control and experiment groups to see the campaign’s effect on sales.
The researcher can also use VBA to automate some tasks, such as entering data collection and cleaning.
Excel’s powerful analysis tools can also help students conduct research, such as breaking down data into groups, identifying patterns, and finding hidden insights.
6. Make Informed and Accurate Predictions
Functions like Conditional Formatting and Trendline can help you accurately identify trends and predict future results.
Conditional Formatting, for example, lets you highlight data in different colors based on a specific condition, such as adding a particular value to a cell. In the example below, if Jim’s debt is over $50,000, then the cell is filled with red.
The trendline shows the general movement of data over time. In the example below, you can observe the change in debt over time by color-coding each line based on the month. It helps you identify patterns and make more accurate predictions for the future.
7. Quick and Convenient Data Input
Sometimes it can be challenging to manage large amounts of data on a spreadsheet. For example, if you are studying for a term on statistics, you may have to look up nearly 300 numbers from a large spreadsheet to input them into your model.
Excel’s AutoFill feature can be a lifesaver when faced with such a tedious task. AutoFill will automatically insert a number into a specific cell based on your selected cells.
The value of AutoFill is that you only need to do the work once, then your entire spreadsheet and all your other sheets will benefit from it.
I have recently shared my perspective on the positive uses of ChatGPT. It is an incredible tool that can provide immense benefits to its users. However, it has come to my attention that some students are misusing it by relying on it to solve their internal exam papers, cheat, and seek quick solutions. To make the most of ChatGPT as a student, it is important to use it in a responsible manner that promotes genuine learning and growth. With this in mind, I encourage you to read on and discover how you can effectively utilize ChatGPT to enhance your learning experience.
Summary
These are only a few tips you can use Excel as a student to improve productivity and efficiency. As you can see, Excel offers a range of benefits that can help you save time and get better grades.
The key is to improve your Excel skills over time, so you can use Excel more often when you need it the most. Some learning platforms offer free training for Excel. Try to take some of the available courses.
Now If you have any queries I would love to hear and answer in the comment…
'Acuity Training' which is well-known for Excel training and courses, contributed to this article, but we support all views expressed.